Wing Pang
Too Warm
For Comfort
2021
zine
How can I (as a designer)
make a difference in the current
climate catastrophe?
The answer that I came to was that people must be educated about the gravity of the situation, as well as given a means to take action in an approachable and easily digestible way.
Without knowing the repercussions of human activity on our planet, there would be no incentive to take action.
Without providing starting points to creating change, people may feel helpless or unsure about how they can make contribute to a better future.
All of this information must also be delivered in a way that doesn't invoke hysteria - that change is possible, and that our planet isn't destined for doom.
Ideation
In order to address all three criteria , I decided that my project will have:
- Reliable information from academic sources.
- A distinct call-to-action with links to climate organisations.
- Simple language and visually engaging layouts/content.
After establishing the criteria of success for my project, I began brainstorming an individual topic (within the broad category of climate change) that my project will explore. In the end, I've decided to focus on the topic of global warming as a result of anthropogenic CO2 emissions.
I wanted my poster to pull the audience in, while the zine informs them about the context of the poster. A couple of topics I initially wanted to dive into more for the zine included:
- Melting icecaps.
- Increased intensity and frequency of bushfires.
- Current CO2 statistics.
Research
In order to have reliable information as foundation of my project, a lot of research was done through scientific and academic sources. One of the starting points I used to find the impacts and current statistics of global warming was the NASA Climate Change and Global Warming website (NASA, 2021). This website provided me with the graph indicating CO2 levels overtime used in the second spread. It also prompted me to explore the issue of acidification caused by the absorption of CO2 in our oceans.
For statistics related to the topic of melting icecaps in spread 3, I used statistics sourced from the National Snow & Ice Data Center website which stated that "glaciers fringing the Greenland and Antarctic Ice Sheets, contributed 27 ± 22 millimeters to global mean sea level rise from 1961 to 2016" (NSIDC, 2019). Meanwhile, statistics related to increased severity and frequency of domestic bushfires as a result of global warming (in spread 5) was found on the Climate Council website (Climate Council, 2019). For more information on acid rain, I looked at the linked journal article from the NASA climate website from USGCRP (Wuebbles et al. 2017).
Upon reading more articles, I also learnt that CO2 contributions from individuals and domestic activities were quite insignificant compared to emissions from large companies (Riley, 2017). Since this is a lesser-known fact, I found it crucial to include in the zine to emphasise the importance of speaking out against environmentally unethical business practices.
By the end of the research process, I've developed five topics to be explored in the zine:
- Melting icecaps.
- Increased intensity and frequency of bushfires.
- Current CO2 statistics.
- Ocean acidification.
- Importance of lobbying against environmentally unethical corporations.
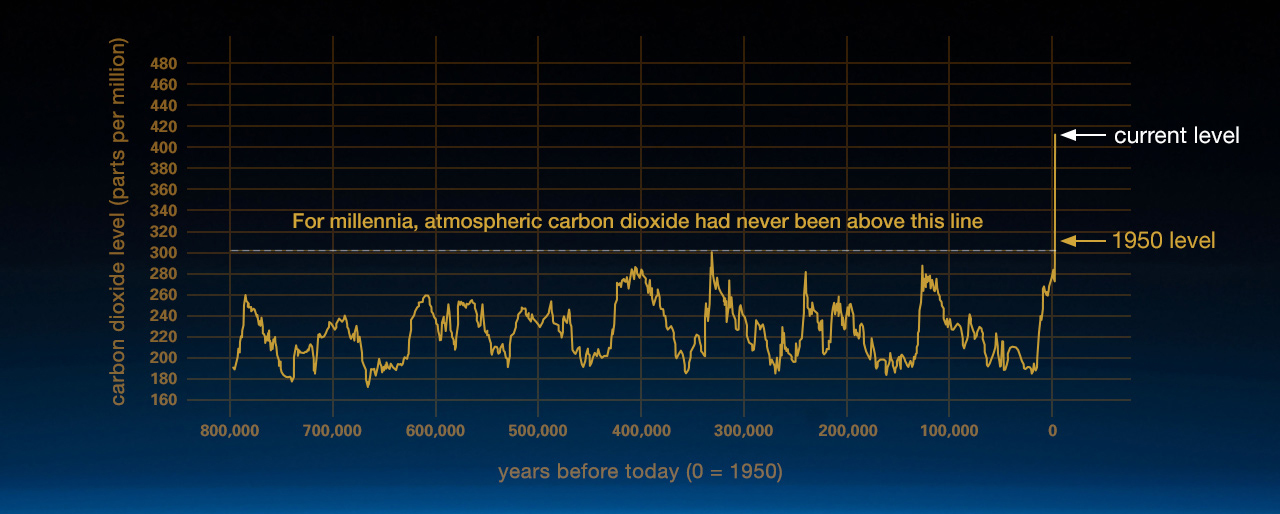
Atmospheric CO2 graph (NASA, 2021).
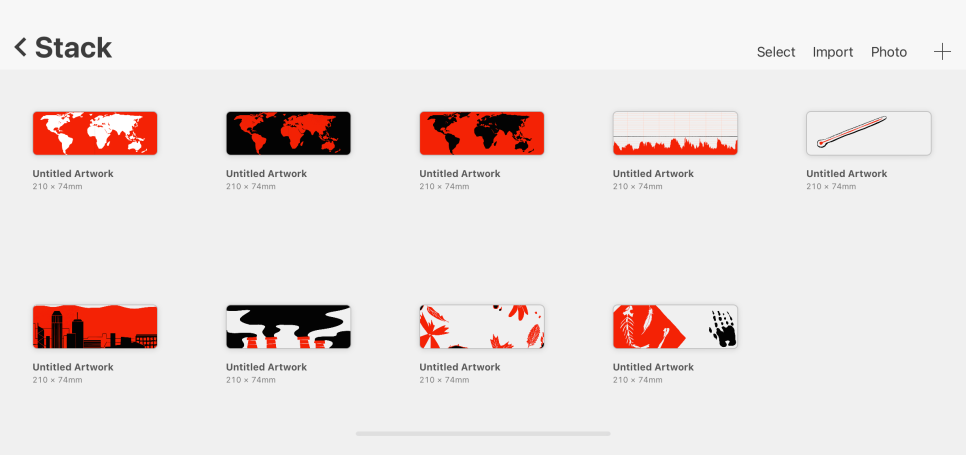
Thumbnailing
After researching and settling on five main topics to explore, I began thumbnailing possible illustrations for the zine spreads and for the poster.
For the first thumbnails I did, the zine was designed in a portrait orientation. There were also ideas for additional attachments to the zine such as polaroids and care tags. However, since the size of the zine was smaller than originally planned, the polaroid cannot fit into the zine. The care tag idea was also scrapped since the A1 poster could not physically fold down to become a cover for the A7 sized zine.
Later thumbnails explored different poster ideas and added upon the initial ideas for the zine spreads. At this stage, I've decided that a landscape orientation allows for a better display of text at a small size. The zine layouts from the secondary thumbnails were essentially the final designs used for the project. The other illustrative concepts for the poster have been rejected due to their tendency to fall under cliche tropes.
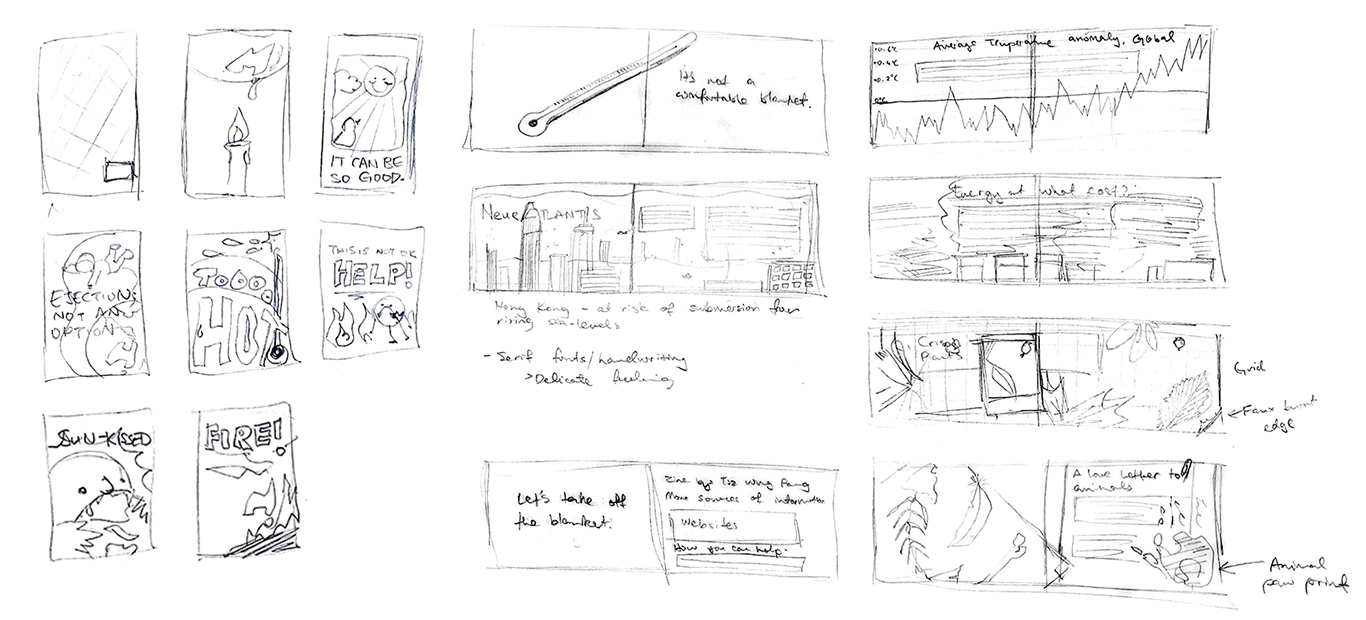
Scanned images of thumbnails.
Experimentation
Experimentation and iteration for this project involved physical material and digital experimentation.
Physical experimentation involved the exploration of mark-making using ink, as well as the use of gouache and watercolour. Originally, the spread with plants was going to be made using ink impressions of real plants achieved during experimentation. However, using traditional medium in only one spread made it visually incoherent, so it was abolished altogether. Gouache as a medium was difficult to control and the colours were also inconsistent. As such, I opted for digital illustration for the entirety of the zine process.
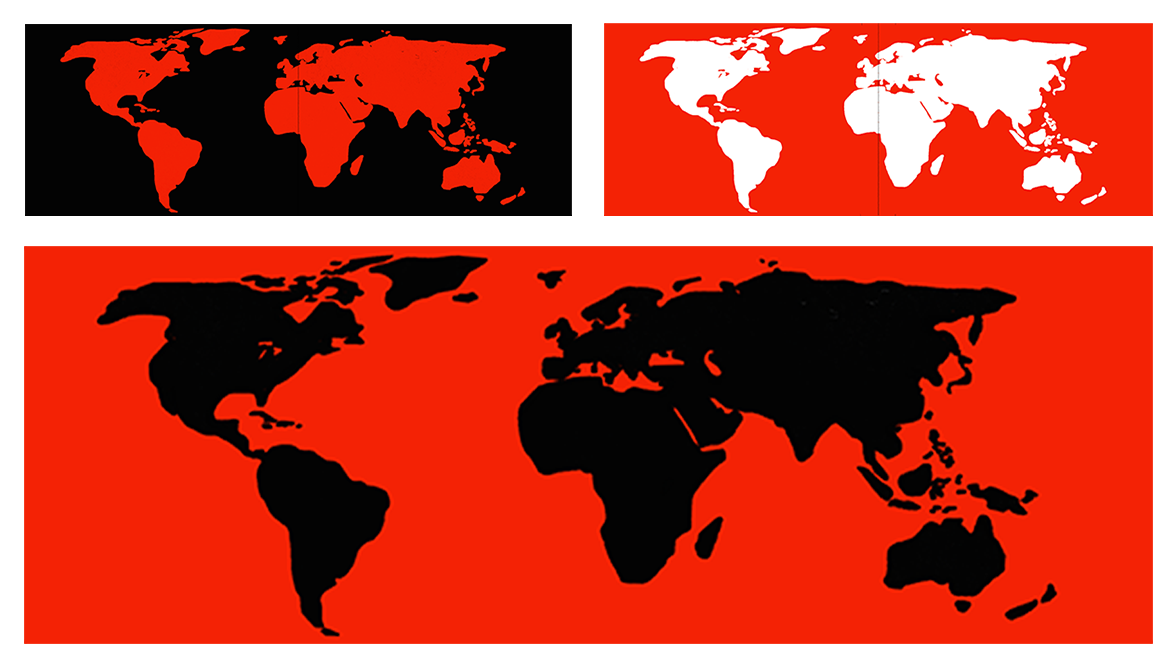
Digital experimentation for the zine did not take much time, as I limited myself to a colour palette of only black and white and red. This is because I felt that this colour scheme works well to communicate the idea of heat. I did however, experiment with alternative colours of the world map used for the zine cover. I chose to go with the black land and red seas since pollution is often carried out on land but causes the heating up of ocean waters.
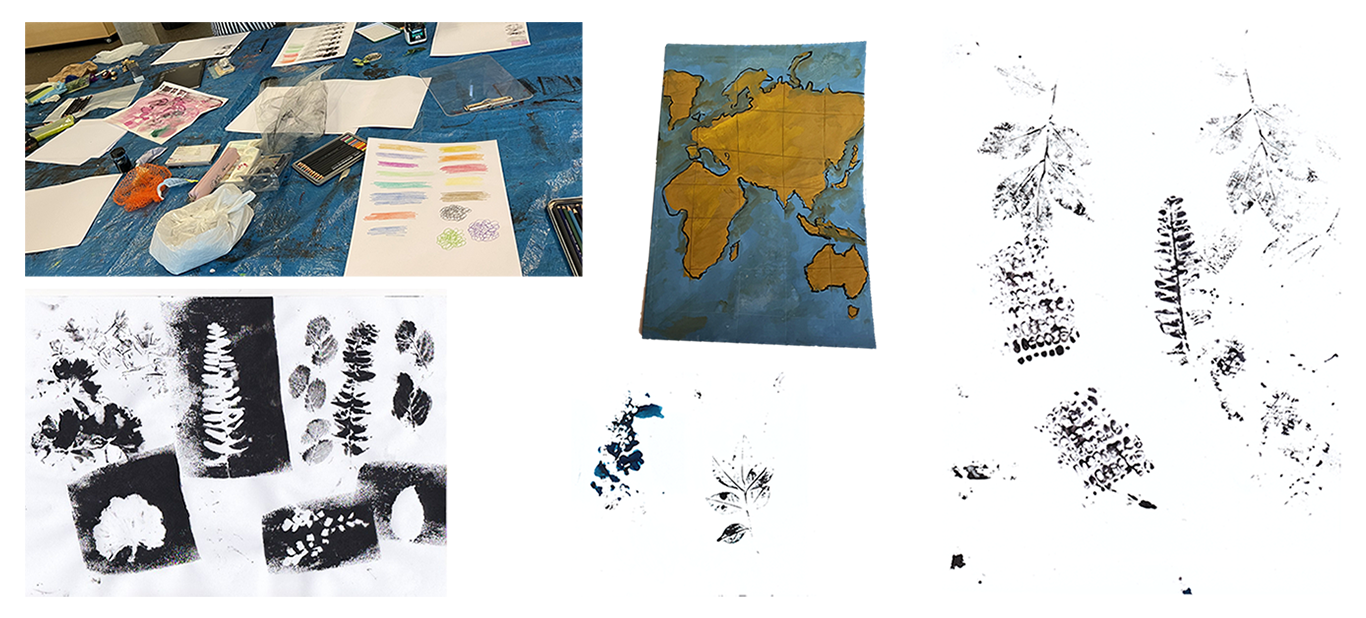
Scanned images of process work.
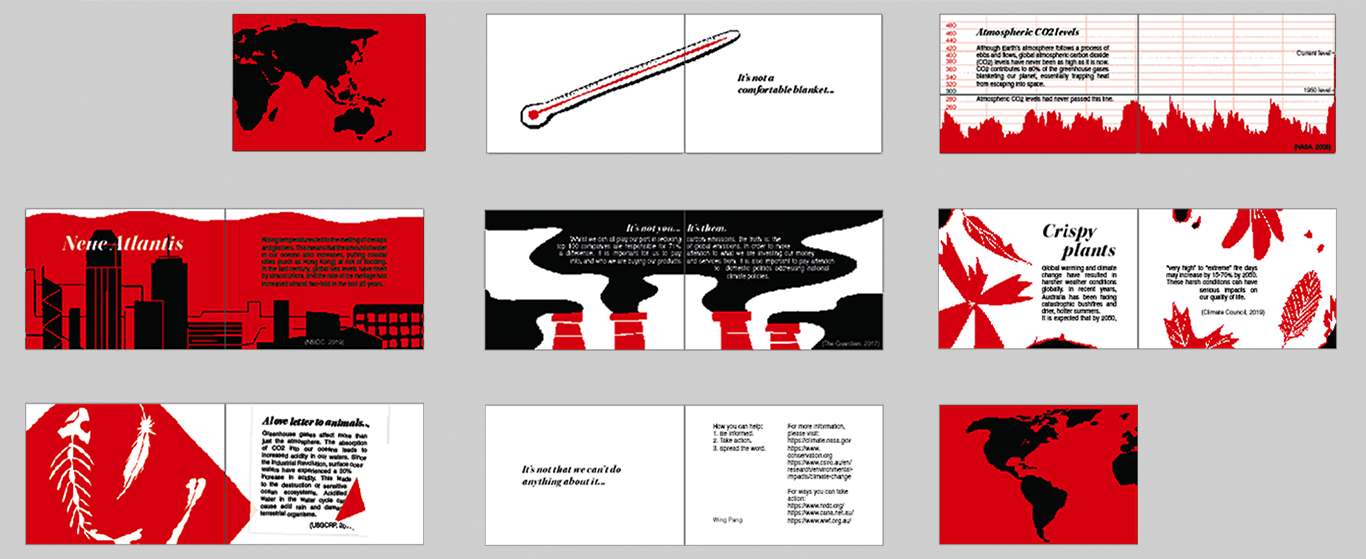
Illustrations
Illustrations for the zine was completed using Procreate on the iPad and typesetting was done on InDesign. The first iteration of the zine featured a wide gutter on the centerfold to accommodate for a stitch that cut through the zine's edge. However, this was changed in the final iteration as the saddle stitch allowed for a cleaner aesthetic. The atlas used for the cover spread of the zine was edited from a vectorised world map in the public domain.
Screenshots of illustration and typesetting process.
Print and Construction
The final stage of the project involved printing and construction of the zine. This involved choosing paper stock, binding technique, and print settings. Initial prints of the zine was completed using cartridge paper while later iterations were printed on 52gsm Tomoe River paper through a home printer. The final zine was Riso printed.
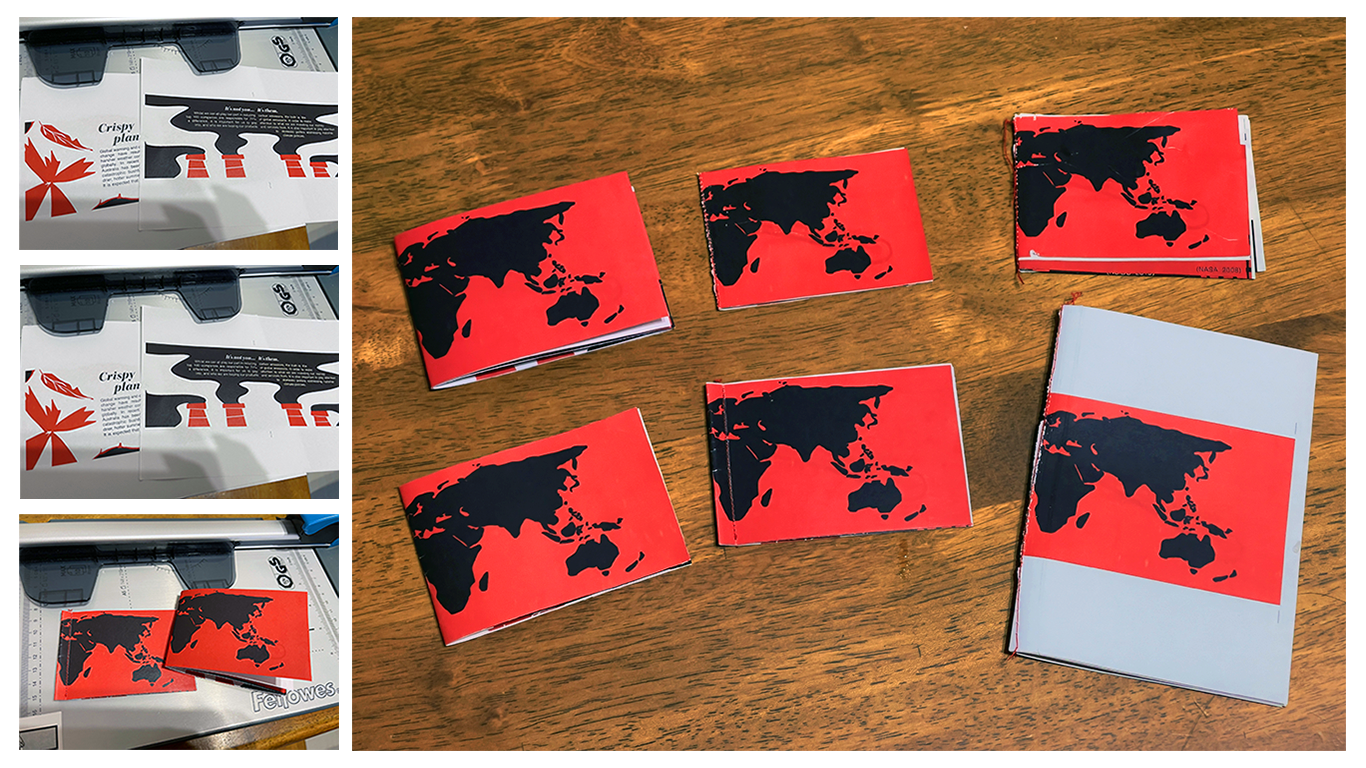
Photos of the home printed zine iterations.
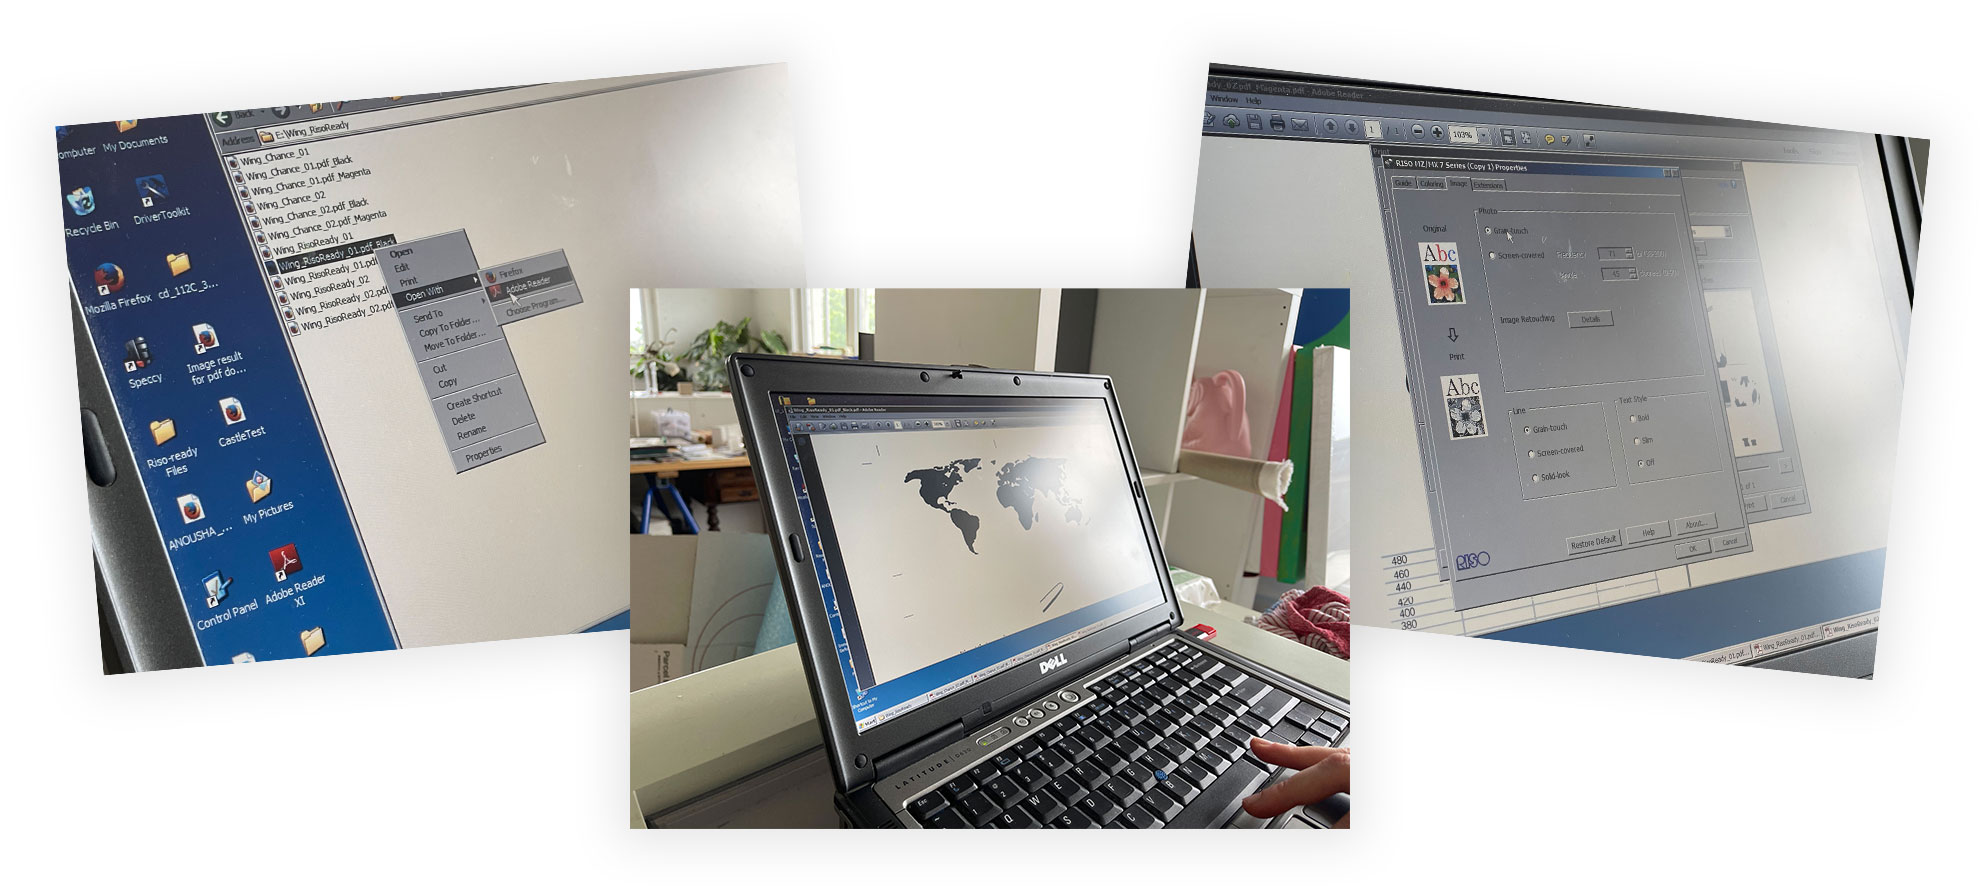
The zine was split into layers digitally. Each layer has one colour (i.e. one for red and one for black). The print setting was put to "Grain Touch" to give a crisp look to the drawings.
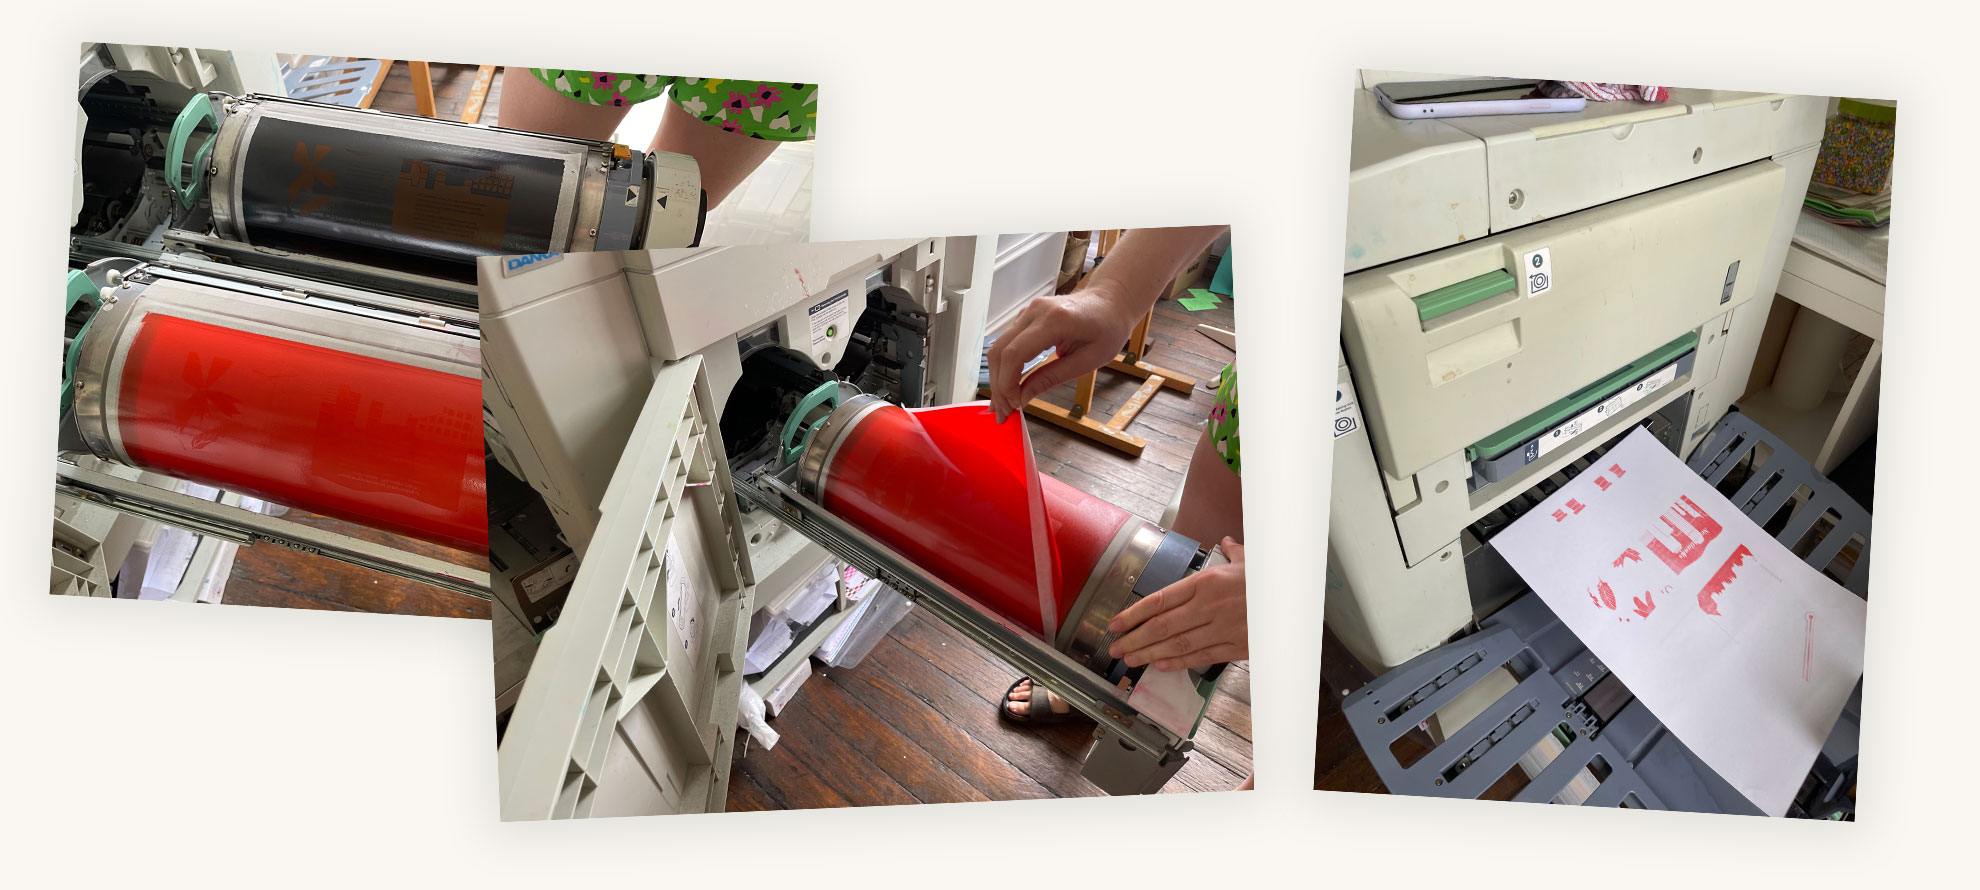
The riso printer was loaded with ink drums. The first print was very faint because the drums weren't fully soaked with ink yet.
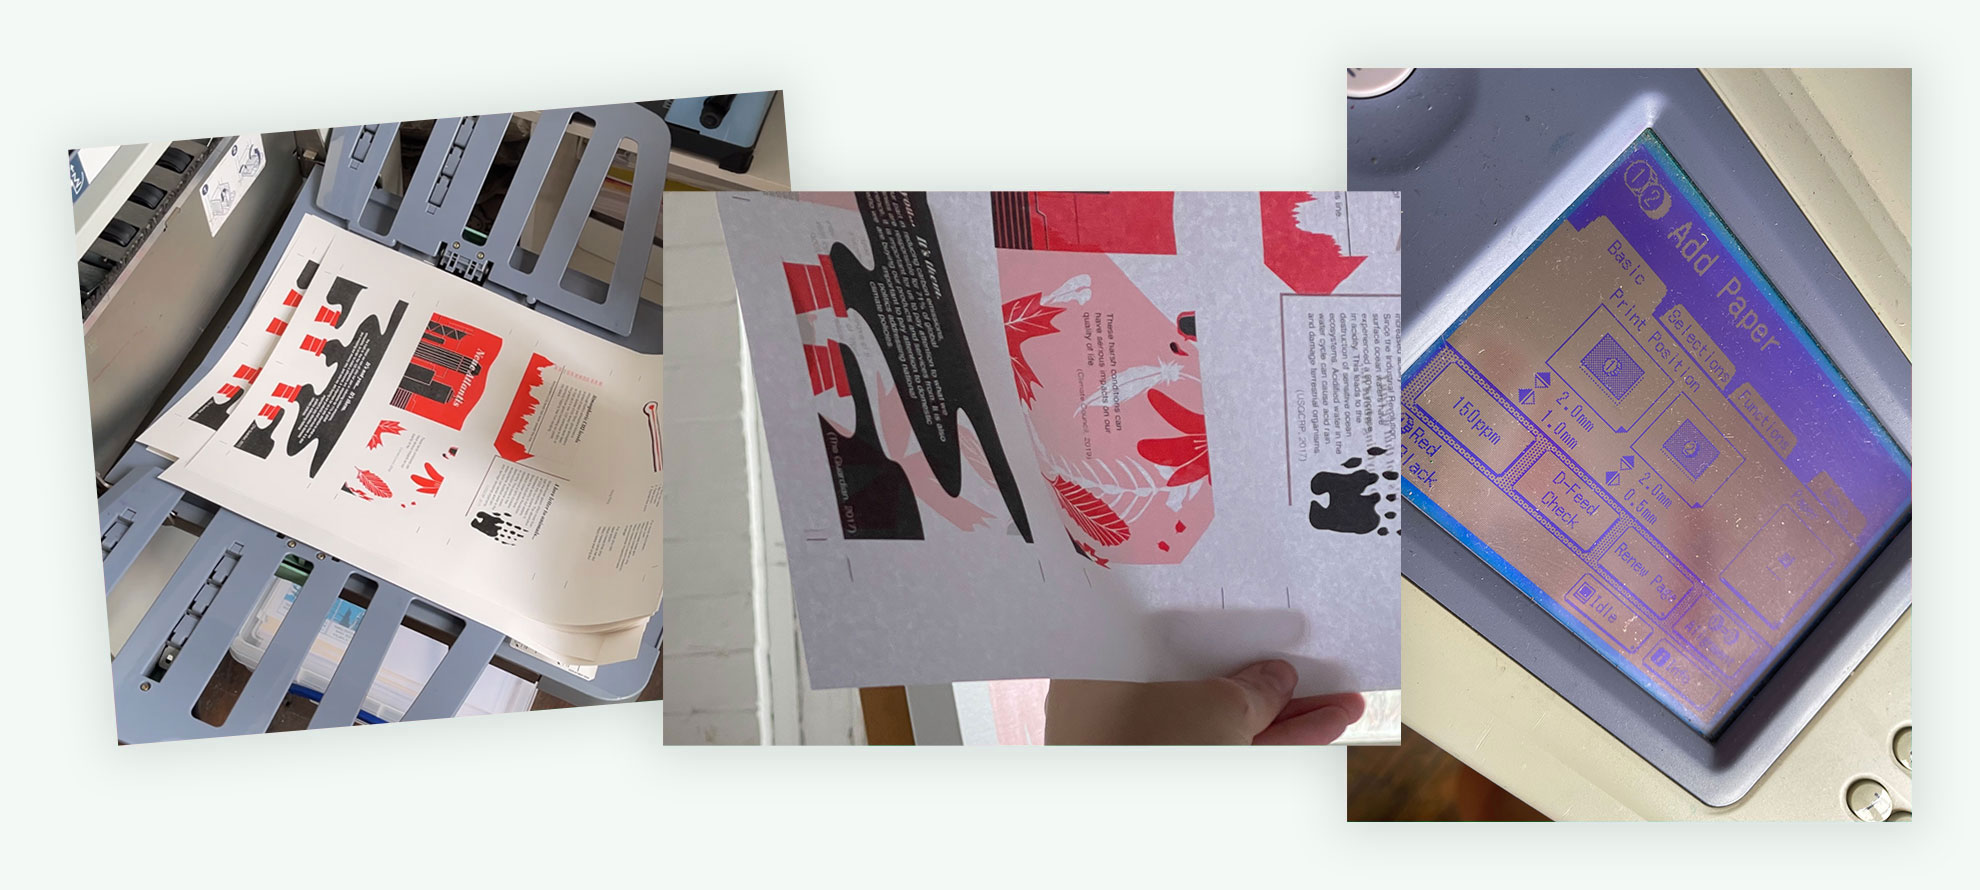
After printing one copy with both sides, the sheet was held against the sun to see if the crop marks aligned. The misalignment was adjusted using the arrow keys on the printer.
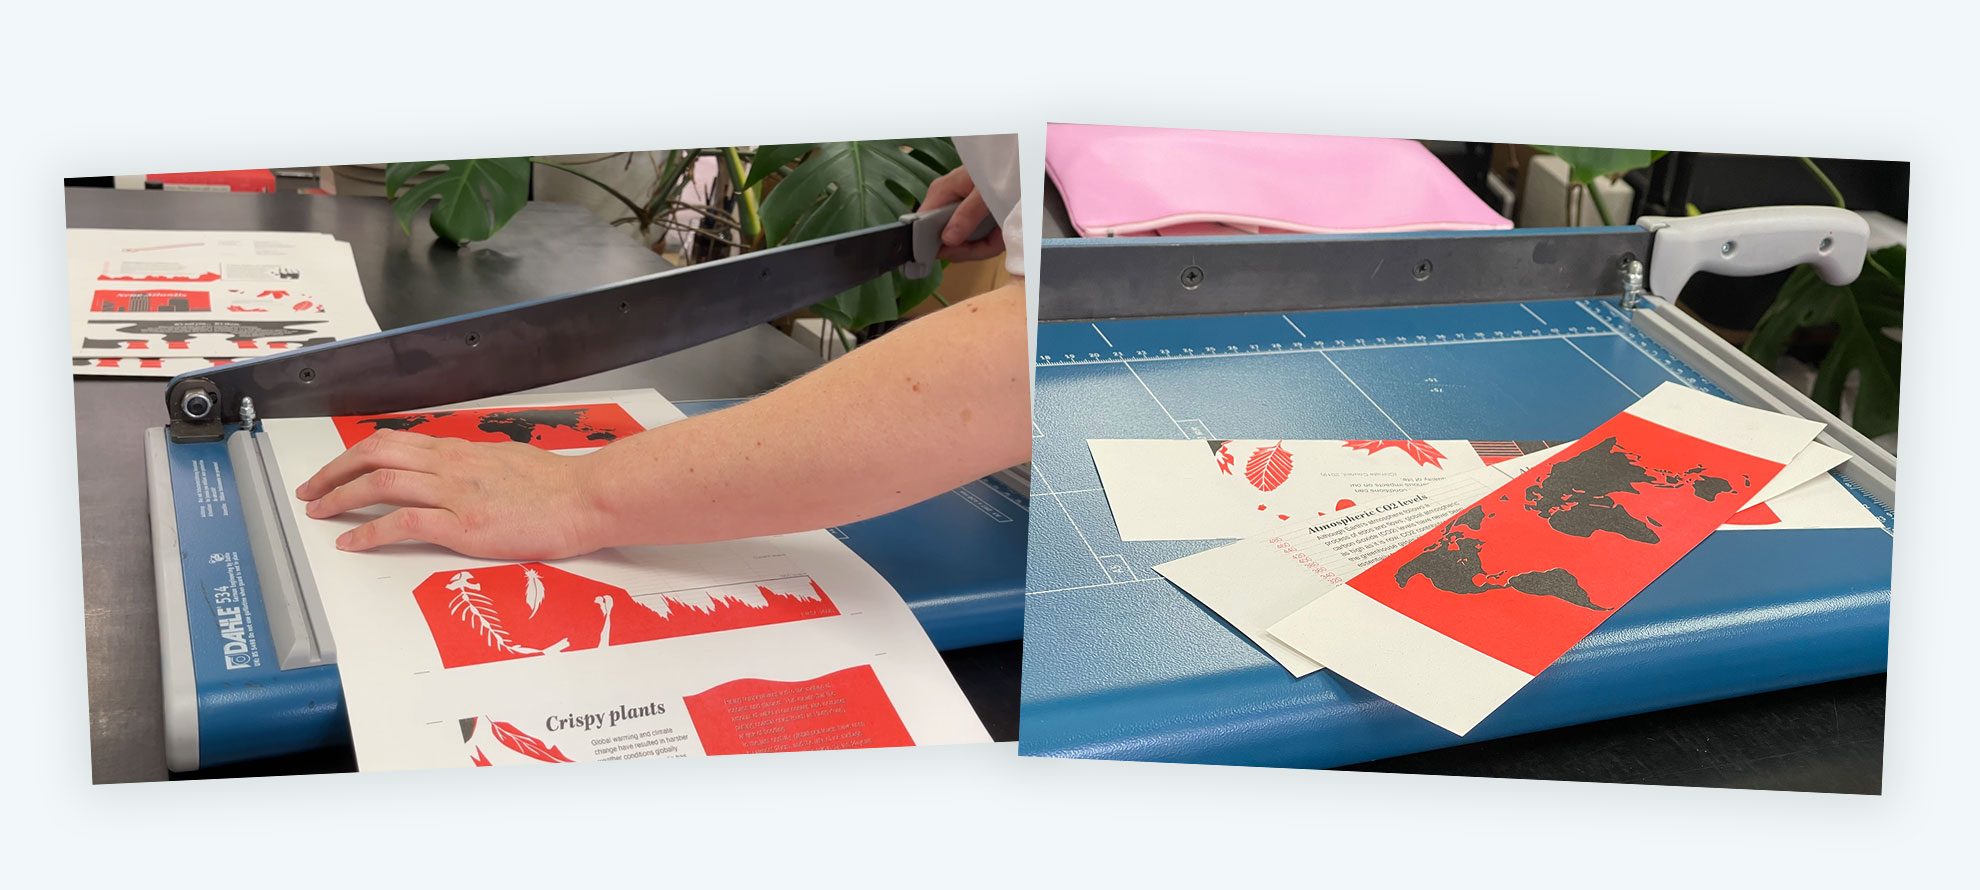
Finally the pages are trimmed and stapled.
Final zine
and reflection
The final zine has five illustrated spreads in an a7 size. The riso printed colours look very vibrant and textural compared to the home-printed variation. However, some areas of the zine that are close to the edge were cut off. In future zines, I'll make sure to set up the document with bleed so that it's easier to crop and align.
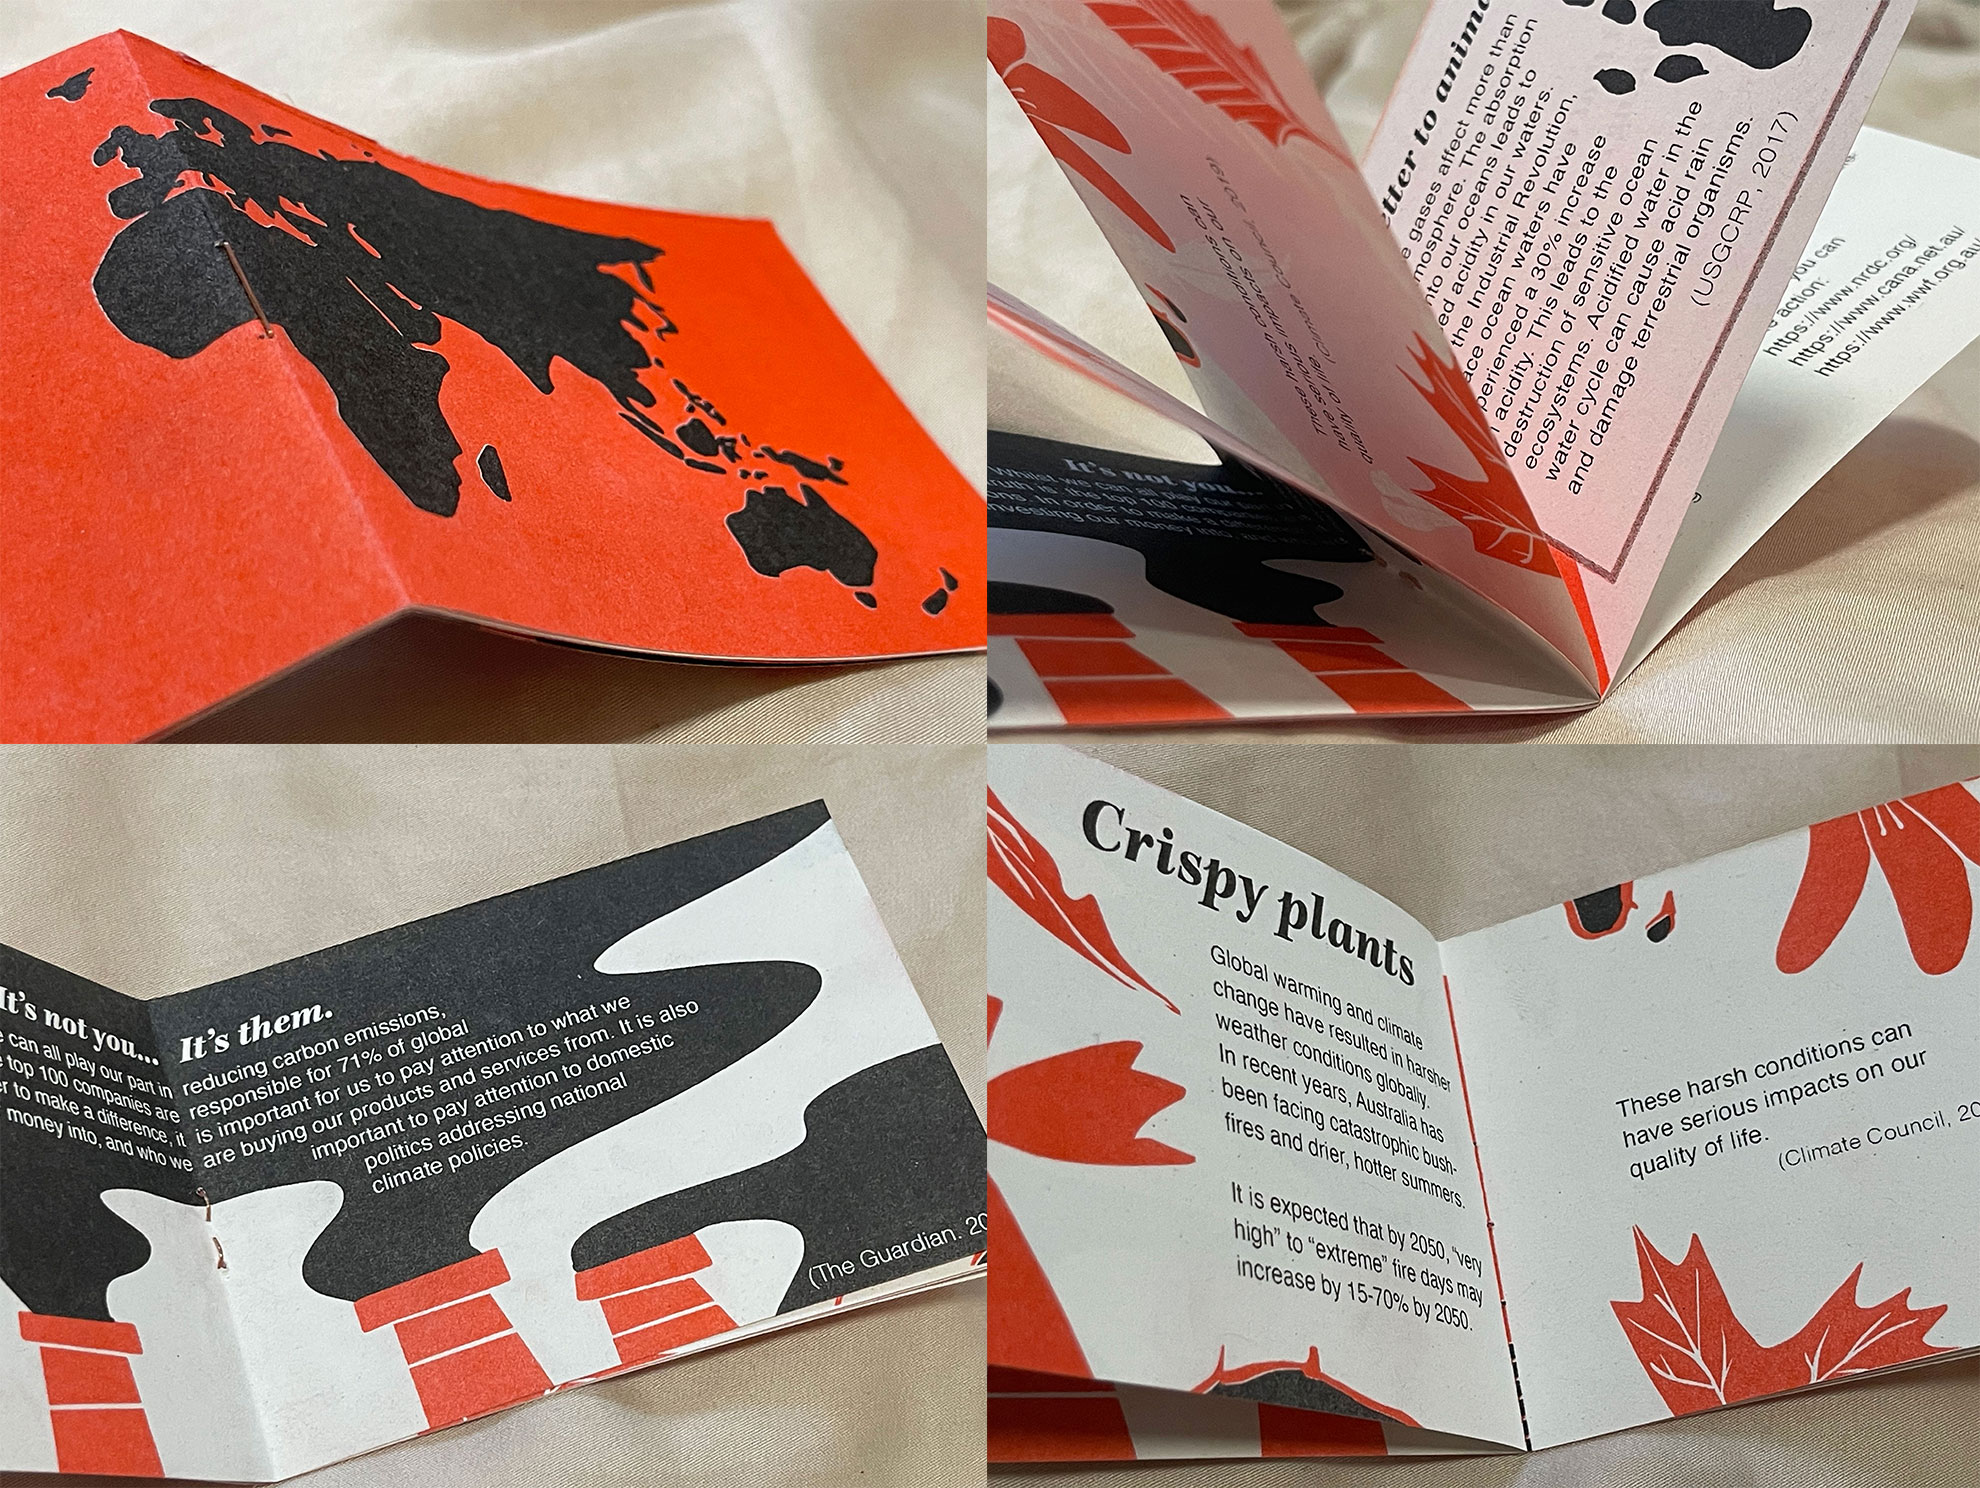
Photos of the final zine.
References
- Climate Council. (2019, November 13). The facts about bushfires and climate change. https://www.climatecouncil.org.au/not-normal-climate-change-bushfire-web/
- NASA. (2021). NASA: Climate change and global warming. https://climate.nasa.gov/
- NSIDC. (2019, June 24). SOTC: Contribution of the cryosphere to changes in sea level | National Snow and Ice Data Center. https://nsidc.org/cryosphere/sotc/sea_level.html
- Riley, T. (2018, February 14). Just 100 companies responsible for 71% of global emissions, study says. The Guardian. https://www.theguardian.com/sustainable-business/2017/jul/10/100-fossil-fuel-companies-investors-responsible-71-global-emissions-cdp-study-climate-change
- Wuebbles, D.J., Fahey D.W. , Hibbard K.A., Dokken D.J., Stewart B.C. & Maycock T.K. USGCRP. (2017). Climate science special report: fourth national climate assessment (NCA4), Volume I. Iowa State University Digital Repository. https://doi.org/10.7930/J0J964J6